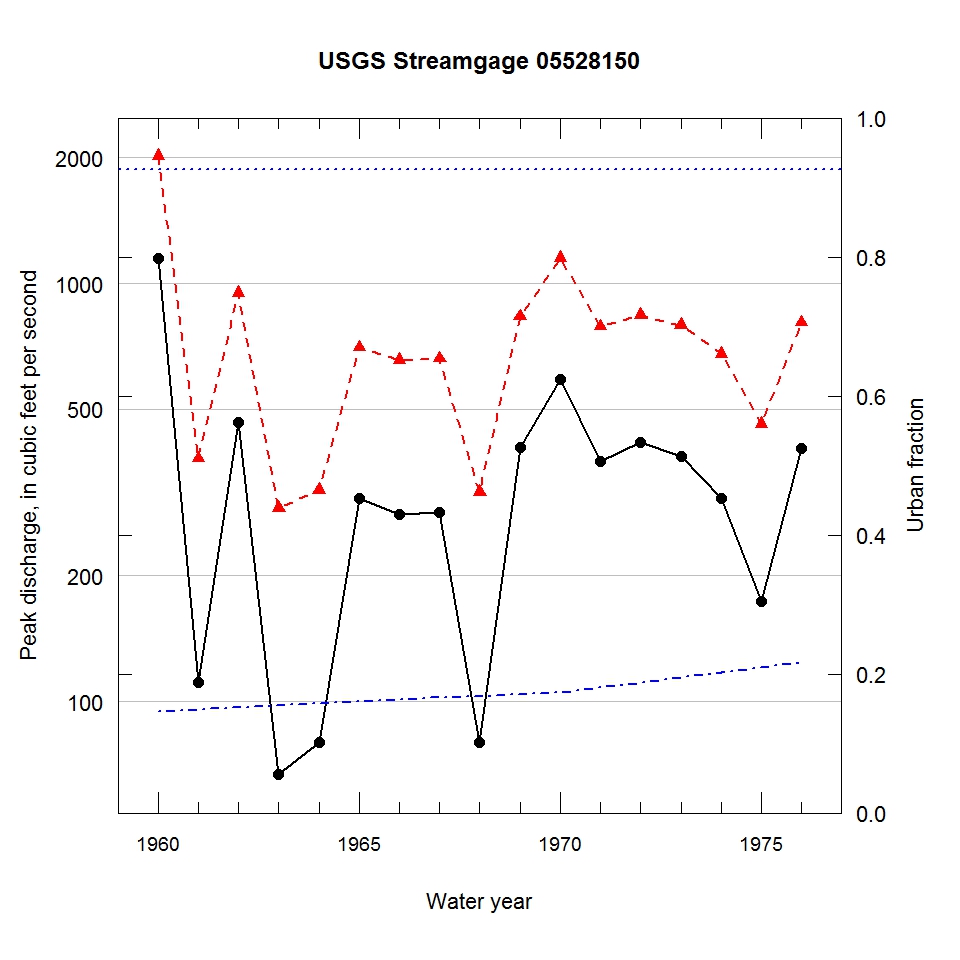
Observed and urbanization-adjusted annual maximum peak discharge and associated urban fraction and precipitation values at USGS streamgage:
05528150 INDIAN CREEK AT DIAMOND LAKE, IL


| Water year | Segment | Discharge code | Cumulative reservoir storage (acre-feet) | Urban fraction | Precipitation (inches) | Observed peak discharge (ft3/s) | Adjusted peak discharge (ft3/s) | Exceedance probability |
| 1960 | 1 | -- | 2070 | 0.147 | 0.500 | 1150 | 2020 | 0.011 |
| 1961 | 1 | -- | 2070 | 0.150 | 1.215 | 111 | 381 | 0.908 |
| 1962 | 1 | -- | 2070 | 0.152 | 0.261 | 466 | 949 | 0.160 |
| 1963 | 1 | 2 | 2070 | 0.155 | 1.259 | 67 | 290 | 0.965 |
| 1964 | 1 | -- | 2070 | 0.158 | 1.733 | 80 | 321 | 0.952 |
| 1965 | 1 | -- | 2070 | 0.160 | 0.565 | 306 | 703 | 0.418 |
| 1966 | 1 | -- | 2070 | 0.163 | 0.476 | 280 | 656 | 0.486 |
| 1967 | 1 | -- | 2070 | 0.166 | 0.924 | 284 | 662 | 0.478 |
| 1968 | 1 | -- | 2070 | 0.168 | 1.248 | 80 | 317 | 0.954 |
| 1969 | 1 | -- | 2070 | 0.171 | 1.342 | 406 | 835 | 0.237 |
| 1970 | 1 | -- | 2070 | 0.174 | 1.511 | 590 | 1150 | 0.080 |
| 1971 | 1 | -- | 2070 | 0.181 | 0.415 | 375 | 789 | 0.294 |
| 1972 | 1 | -- | 2070 | 0.188 | 1.198 | 417 | 841 | 0.230 |
| 1973 | 1 | -- | 2070 | 0.195 | 1.436 | 386 | 796 | 0.284 |
| 1974 | 1 | -- | 2070 | 0.202 | 1.114 | 306 | 679 | 0.453 |
| 1975 | 1 | -- | 2070 | 0.210 | 1.115 | 174 | 461 | 0.804 |
| 1976 | 1 | -- | 2070 | 0.217 | 1.257 | 403 | 807 | 0.270 |

